Election Day 2018: a day that holds magic keys to a large part of the immediate future of the United States of America. Today, millions of Americans — and apparently many more than in normal midterm elections — are headed to the polls to decide (among numerous state and local offices) who will represent the American populace in 435 chairs in the House of Representatives along with an assortment of U.S. Senate seats. This will probably go down in history as the most contentious midterm election in the U.S. And many are already saying it is the most important election in our lifetime.
This election just like most is driven by media polls. Media polls are as different from each other as the North is from the South. Each polling entity claims to have the most accurate results, the fairest and most comprehensive samples as the basis for their numbers, and they all poo-pah their competition. But are they accurate?
The Polls
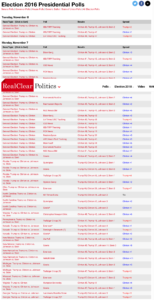
Take a look at the Real Clear Politics list of polls from the day before the 2016 election and on election day:

I know it’s tough to read because there are so many lines that include the polls from multiple polling companies and their data summaries. The point to make with this is illustrated best by looking at the far right column in which Real Clear Politics shows the final numbers for each poll on each day based on the party color of the candidate that is ahead. Note that in that far right column, almost every poll is blue — Democrat. And that means Hillary Clinton. The few lines that show red final numbers are Trump’s. According to every national polling service but one, Donald Trump was to lose in a landslide to Hillary Clinton.
Leftists explain this away by stating that the polls showed only the popular vote. (Hillary reportedly won the popular vote by over a million votes.) What those same leftists do not want to mention is that we do NOT elect presidents by popular vote. The electoral college determines the ultimate winner in presidential elections.
Polls showed that Hillary Clinton would win by a landslide in the electoral college as well. The Real Clear Politics summary poll of the electoral college projections showed Hillary would win that vote 331-207. Trump won the electoral college AND the White House 306-232. How and why do these guys miss so badly?
Let’s just be completely honest:
- There are 335 million people in the U.S. How can any polling company put create a fair template that actually models accurately a sample of American voters? It is a virtually impossible task, as their results prove. What’s a sample size that should be considered a “fair” sample? What mix of cell phone and landlines to use in contact is truly representative? What percentage of party split is accurate in the chosen geographic region of the sample used?
- How do they create their samples? The term we have all become familiar with as a result of the Facebook scandals is “algorithm.” Every polling entity prepares a secret algorithm (or “formula”) that supposedly factors in each variable that is integral in accurately estimating who to poll in the polling process which includes specifics of those polled and the compilation of their polling results. That algorithm must include accurate estimates of likely voters within each of these classifications: male or female, age, ethnicity, income level, employment status, homeownership status, education level, voting history, marital status, and, of course, political party affiliation.
- What days of the month and/or days of the week should polling calls be made? Who should make those calls: male or female, African-American or Caucasian; English speaking or Spanish or “other;” which area codes and which exchanges to include; the actual questions that are asked; how many questions; how long should each call be; the time of day to place calls. Often those called refuse to answer certain questions asked. How many answered questions must occur in each call to include those results in polling data?
There are many more questions to be considered.
Polling Companies
Here’s an alphabetical list of the 22 best known national election polling companies. Included are the hyperlinks for you to use. If you want to look at any of these companies’ websites, just click on the highlighted company name to be linked to their site. It is noteworthy that there are dozens of more such companies in existence. Most of those are specialty or “niche” polling services that specialize in certain types of polls. Those have not been included.
- Elway Research
- Field Research Corporation (Field Poll) – see Mervin Field
- Gallup Poll
- Harris Interactive
- Ipsos
- Marist Institute for Public Opinion
- Monmouth University Polling Institute
- NORC at the University of Chicago (formerly the National Opinion Research Center)
- Nielsen ratings
- Pew Research Center
- Public Policy Institute of California
- Public Policy Polling
- Quinnipiac University Polling Institute
- Rasmussen Reports
- Siena Research Institute at Siena College
- St. Norbert College Strategic Research Institute (Wisconsin Survey)
- Suffolk University Political Research Center (SUPRC)
- SurveyMonkey
- SurveyUSA
- Susquehanna Polling & Research
- YouGov
- Zogby International
The purpose of listing these is to illustrate just how many “reputable” companies there are who extrapolate data from likely voters in each election — local, state, or national — to fulfill specific polling requirements. Why do these companies go to such trouble when everyone knows that poll results are at best sketchy, at worst totally unreliable?
Virtually every campaign organization budgets some amount of money to do their own “internal” polling. Most candidates foam at the mouth for the status of probable votes during each campaign. To get those results, someone must obtain the numbers and compile the data. National campaigns spend millions of dollars in each campaign cycle for polling data.
It is strange to me that while knowing just how unreliable is most polling information given by the polling entities, campaigns continue to beat the drum called “Numbers.” Why is that?
Good polling numbers mean good campaign contributions: “Follow the Money!”
Poll Results Morph into Campaign Bucks
It has always puzzled me why Americans allow this election campaign financial boondoggle to continue. Yet every two years, we all signup to be willing participants in it. How much do these campaigns cost?
The final price tag for the 2016 election is $6.5 billion for the presidential and congressional elections combined, according to campaign finance watchdog OpenSecrets.org. The presidential contest — primaries and all — accounts for $2.4 billion of that total. That means that in the 2016 Congressional election process, candidates spent $4.1 billion. The 535 members of Congress each spent an average of $7.663,551.40 in their campaigns. But wait: not every Senate seat was in that election. That means that the actual dollars spent for each seat for which there WAS an election was higher than $7.663,551.40!
Let’s look at Congressional dollars and cents another way: how much in salary and benefits do members of Congress make?
- The current salary (2018) for rank-and-file members of the House and Senate is $174,000 per year.
- Leaders of the House and Senate are paid a higher salary than rank-and-file members.
Senate Leadership
Majority Party Leader – $193,400
Minority Party Leader – $193,400House Leadership
Speaker of the House – $223,500
Majority Leader – $193,400
Minority Leader – $193,400
Members of Congress receive retirement and health benefits under the same plans available to other federal employees. They become vested after five years of full participation. Since all provisions of the Affordable Care Act or “Obamacare” took effect in 2014, members of Congress have been required to purchase health insurance plans offered through one of the Affordable Care Act-approved exchanges in order to receive a government contribution toward their health coverage.
Average Annual Pensions
According to the Congressional Research Service, there were 611 retired members of Congress receiving federal pensions based fully or in part on their congressional service as of October 1, 2016. Of this number, 335 had retired under CSRS (former retirement program) and were receiving an average annual pension of $74,028. A total of 276 Members had retired with service under FERS (current retirement program) and were receiving an average annual pension of $41,076 in 2016.
Allowances
Each member of Congress receives an amount of money each year — an “Allowance” — from which support staff personnel and all office and travel expenses are to be paid. In 2016, for example, the office personnel allowance for each member was $944,671 to be spent on up to 18 staffers.
Summary
No doubt, some will shake their heads when realizing just how much money those 535 members of Congress cost taxpayers — not to mention the additional expenses required to operate Congress and the U.S. Capitol. (See “The “Bottomless Pit:” The U.S. Congress published here at TNN on October 18, 2018, to get exact costs of everything to taxpayers for Congressional operations) But even knowing that, how can anyone in their right mind obligate themselves every two years to raise an average of $7.66 million to pay for a campaign to obtain a job that at most pays them $200,000 – $250,000 per year? Why would they?
The only logical answer again is “Follow the Money.” The “off-ledger” financial benefits of serving in Congress are staggering. (again see details in that October 18th story) It’s for the “whole banana” they do it. That’s why it is so important to raise all that campaign money — not just to pay for their actual costs of simple campaigns. They must raise and spend those millions to secure election victories, often with little or no consideration of policy matters. And far too often, the concerns and desires of the voters from the districts for which those candidates seek election are seldom concerns to the candidates, if they are ever that important!
Now you understand just why election polls are so important and therefore attract dozens of companies that charge millions of dollars to turn out results of voter preferences.
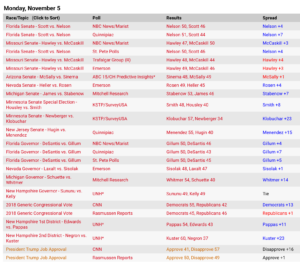
You see above just how accurate those polling entities were in the runup to the 2016 elections: they were horrible. What do they think about election results for these midterms? I’ve posted the Real Clear Politics numbers released today. (see below) Save those and Wednesday compare their accuracy to the inaccuracies across the board from 2016.
You’ll see how little accuracy in projections of election results really are. And you’ll understand why Americans should summarily disregard election polling results — PERIOD. They are all “About the Money!”
Real Clear Politics Monday, November 5, 2018


